Bipolar and likert matrix questions
A matrix table can be used when asking about the same set of characteristics for multiple items, such as how often a respondent uses a set of products. The questions are arranged in a table or a grid to consolidate the information for the respondent.
There are two types of matrix - likert and bipolar. Each type has unique options and a unique format.
Likert
The likert variation displays a list of statements (rows) and scale points (columns) in a table format. Question options can be single answer, multiple answer, drop-down list or drag and drop.
Bipolar
A bipolar matrix table displays two extremes of a scale set by the survey admin. Respondents select a point between the two. Those point can also be labeled.
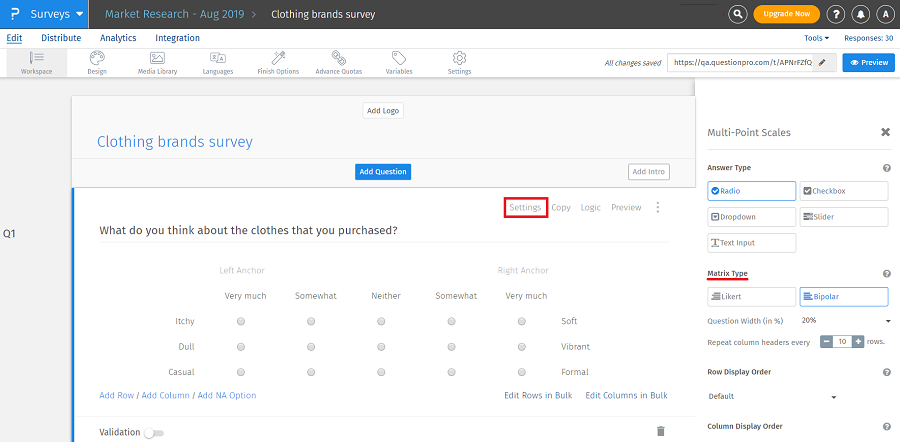
- After selecting the multi-point scale matrix question, click on Settings in the question.
- Under Matrix type section, select bipolar.
- Click on Edit columns in bulk. You can enter your own scale or select from scale library.
- Click on Edit rows in bulk. Enter options in the rows.

To view the report for matrix multi-select question:
- Go to: Login » Surveys (select a survey) » Analytics » Dashboard.

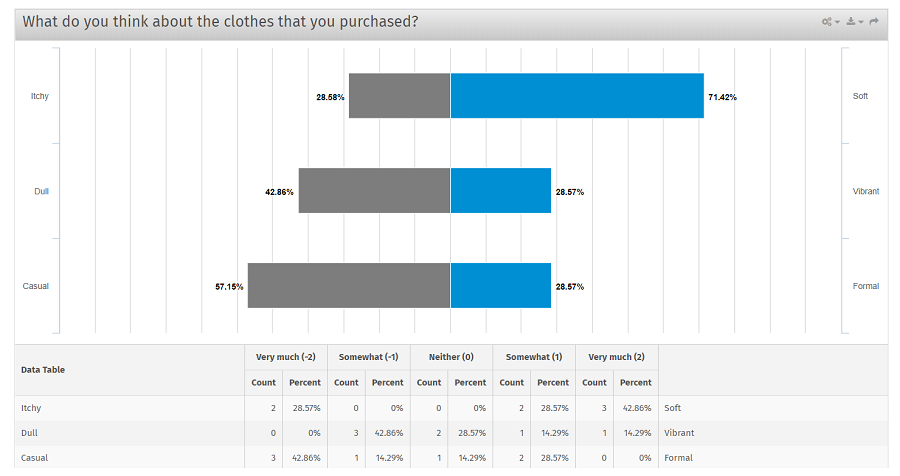
- In the above image, report for bipolar matrix question is represented in the form of a graph showing percentage of responses received for each option. The percentage on the left-hand side shows responses received for the options in the left rows with reference to the respective columns. Similarly, the percentage on the right-hand side shows responses received for the options in the right rows. For example, count for "itchy" with reference to column "very much" is 2 (28.57%). The reports for individual rows are also displayed where you can see the count, total count and percentage.
- Count: Number of responses received for each combination of row and column ("very much" and "itchy").
- Percentage: This is the percentage calculated for the count for that row out of the total responses recieved.
Formula: Percentage = Count/Total count * 100. For example, count for "very much" and "itchy" is 2, total count recieved for that row is 7. Hence, the percentage is 28.57% (2/7 * 100).
This feature is available with the following licenses :

